Envest
Financial research platform
A research and portfolio intelligence platform for equity analysts — real-time market data, historical analysis, and SEC filings, combined with RAG over public and private documents. Grounded AI Q&A with traceable citations, live charts, and instant document generation.
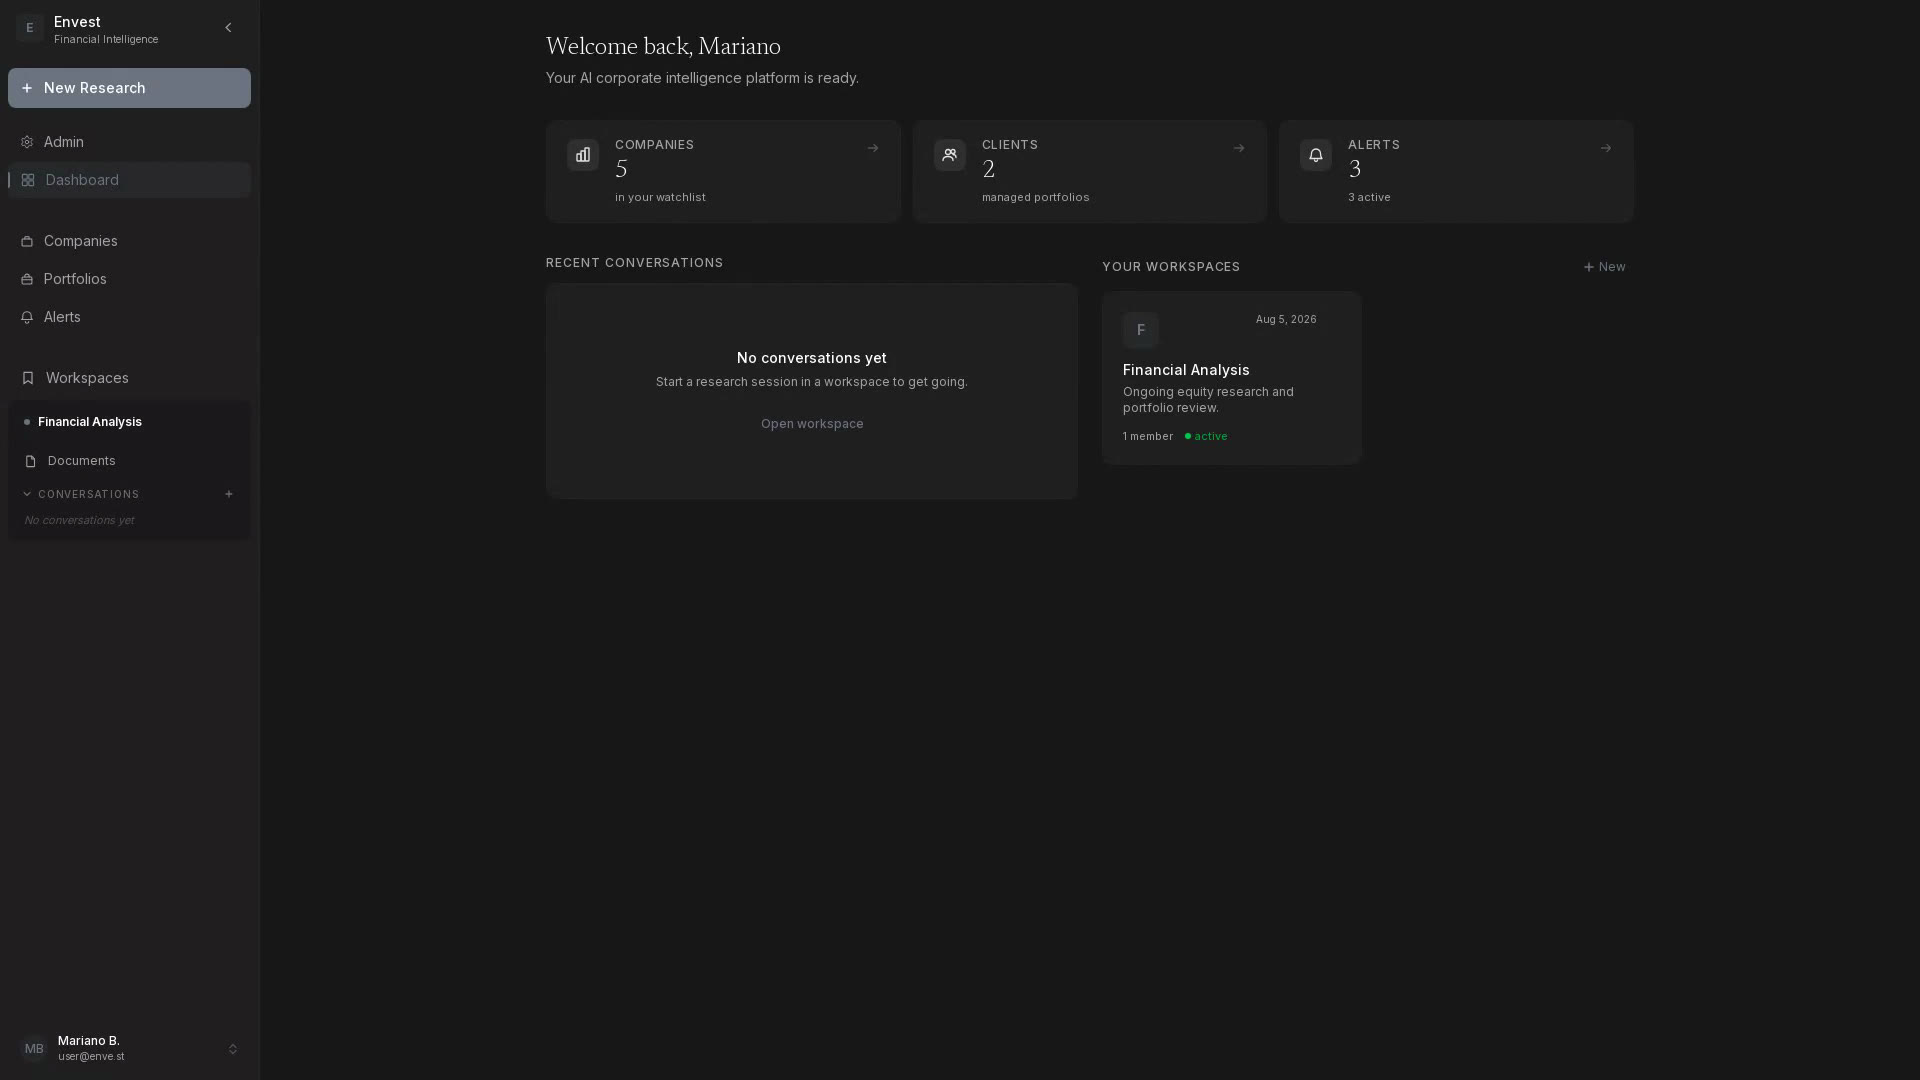
What Envest is
Envest is a research and portfolio intelligence platform for equity analysts, portfolio managers, and independent researchers. Most research tools answer "what does the document say." Envest is built to answer a longer question: what's true, what it means for a portfolio that already holds the position, and what's worth acting on — research, portfolio state, and monitoring, in one conversational surface instead of three disconnected tools.
Every answer comes with a citation you can click straight through to the source — a specific line in a 10-K, an earnings call transcript, a market data point. Traceability isn't a feature bolted on afterward; it's the constraint the rest of the system was designed around.
Integrating the data
A financial research platform is only as good as the data underneath it, and that data comes from sources that don't agree on format, freshness, or cost:
- SEC filings — ingested directly from EDGAR: 10-K, 10-Q, and 8-K filings for the ~8,000 companies listed on NYSE, NASDAQ, and NYSE American, plus structured fundamentals (P/E, EV/EBITDA, revenue, margins) parsed straight from XBRL.
- Market data — historical daily prices and a near-real-time snapshot, normalized behind a provider-agnostic data layer so the source can be swapped without touching the analytics or visualization code above it.
- Sector and historical multiples — a company's live P/E isn't meaningful on its own; it's compared against its sector peers' median and against the sector's own ~10-year historical range, pulled from a third-party market-data provider's own multiples history rather than bounded by whatever window we've locally ingested.
- Macro series — Fed Funds Rate, Treasury yields, CPI and similar indicators from FRED, correlated against a holding's own returns over the same window — using the change in the series, not the level, since correlating against a level produces a misleading number.
- Earnings call transcripts and private documents — indexed and chunked for retrieval, so a question like "what did NVIDIA say about data center demand on their last call" resolves to the actual excerpt, not a paraphrase.
- A client's actual portfolio — transactions, positions, and exposure, so a question about a company isn't answered in the abstract if that company is already something a client holds.
How it's put together
An LLM orchestrator (OpenAI function calling) interprets the question, decides which tools to call — sector valuation, correlation, historical comparison, document search — and in what order, chaining multi-step reasoning without hand-written routing logic. Below that sit three purpose-built engines: a data engine that normalizes whatever provider a given data type comes from, an analytical engine that computes returns, volatility, drawdown, and correlation, and a visualization engine that turns a declarative chart specification into an interactive line, bar, scatter, or heatmap chart — decoupled from the conversational layer, so adding a new chart type is a visualization-layer change, not a rewrite of how the assistant reasons.
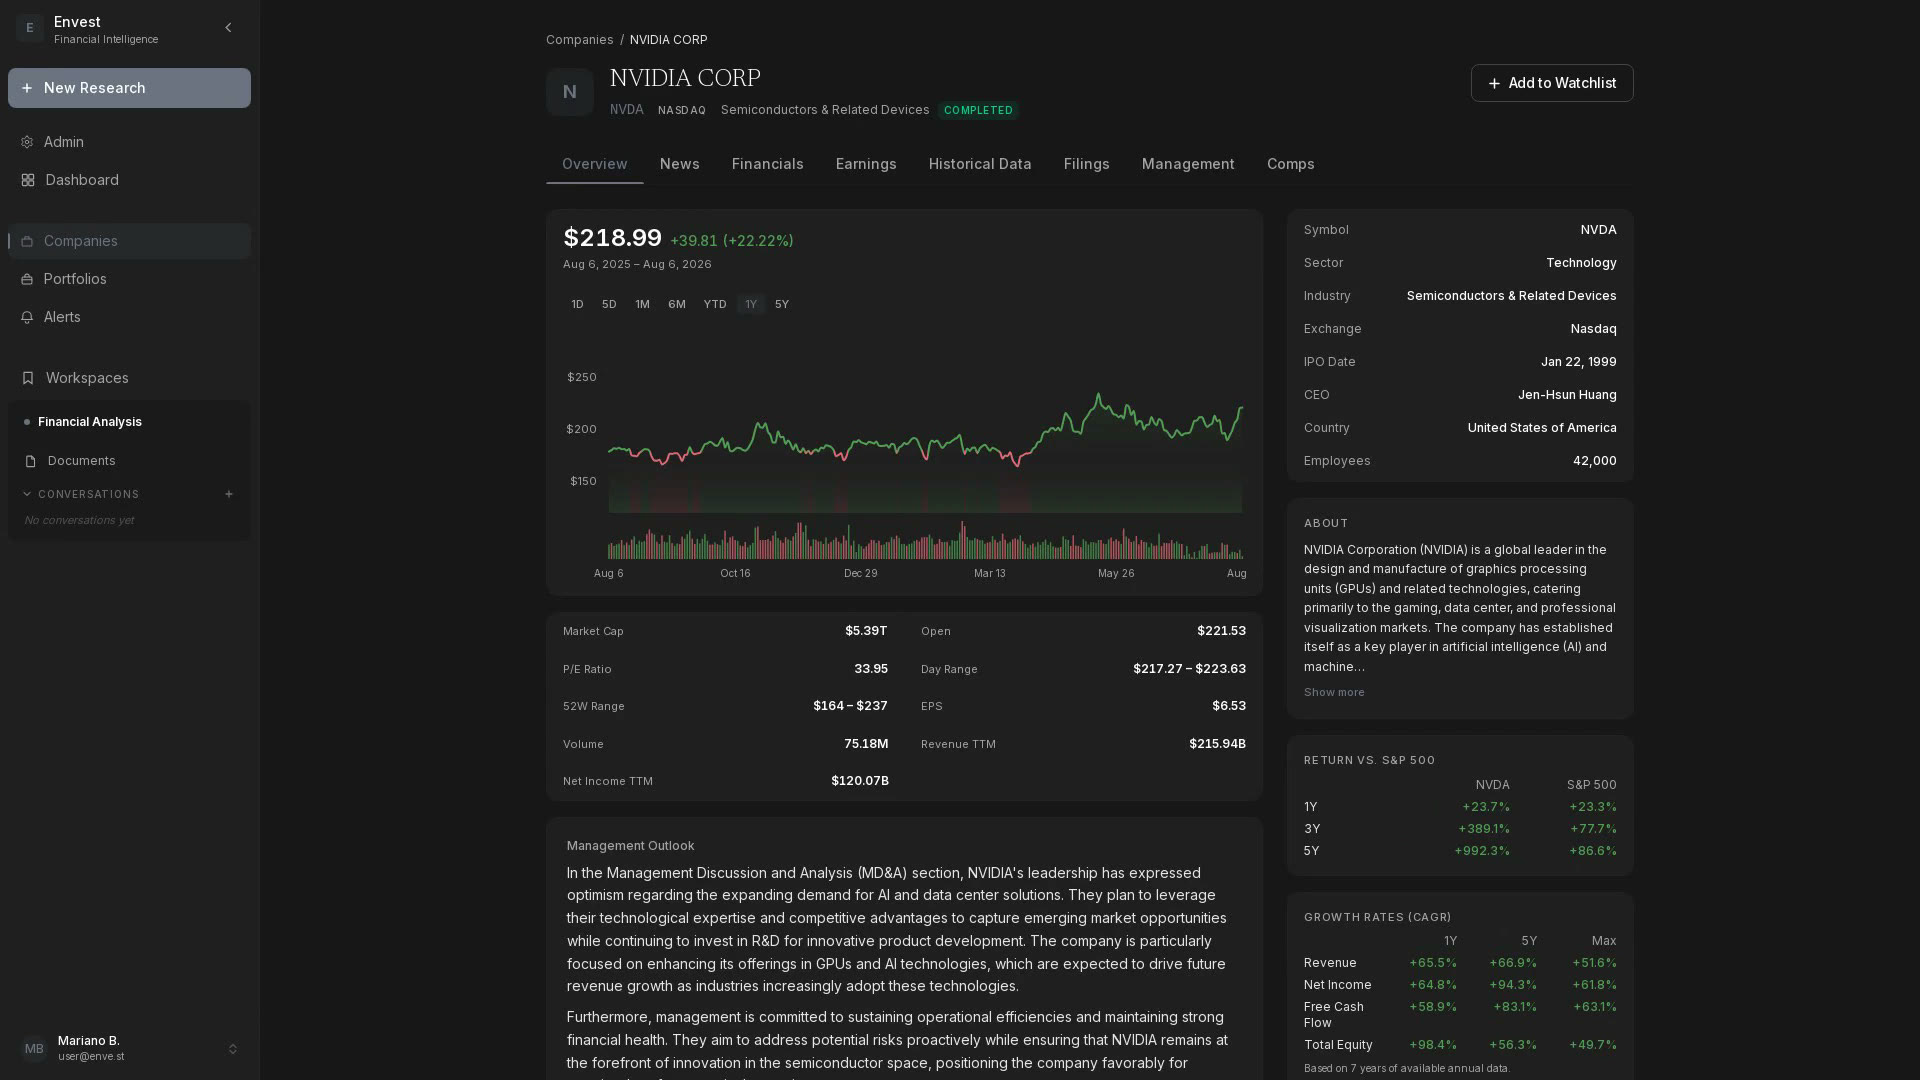
The result surfaces as: a dashboard, eight-tab company research (Overview, News, Financials, Earnings, Historical Data, Filings, Management, Comps), a one-click watchlist that starts pulling filings and price history immediately, price alerts, shared workspaces per thesis or client review, and — once a conversation produces something worth keeping — a Word, Excel, or PowerPoint document generated in seconds, with the same citations carried through.
Under the hood: a FastAPI + SQLAlchemy 2.0 backend on async Postgres, a Next.js + React frontend, and a full multi-tenant model — organizations, workspaces, roles, audit trail — because research and portfolio data at a bank or a fund is sensitive by default, not as an afterthought.
A closer, more technical look at one real engineering session building three of these analytical tools — and the six real bugs that came with it — is in our write-up on it.